 |
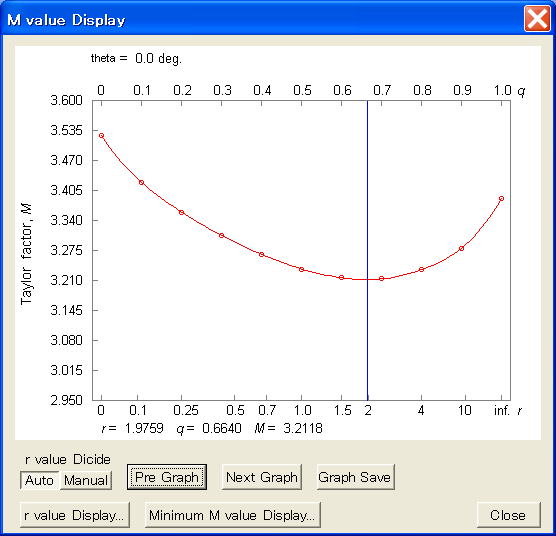
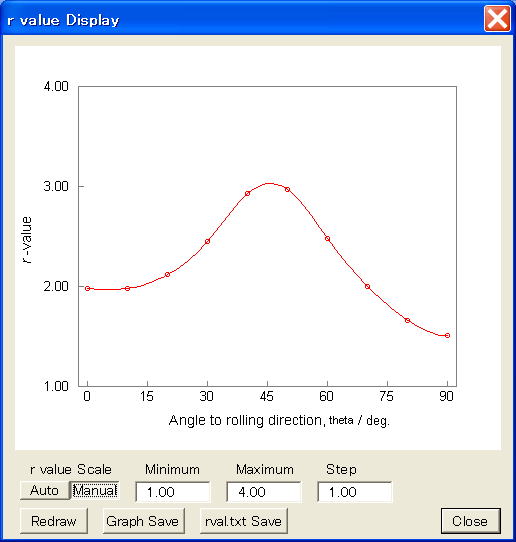
| Display of Analysis Result At first, the analysis result of Lankfordn is displayed as [M value display]((r value,M value)graph for each theta). After that, based on [M value display], [r value display] ((theta, r value) graph) and [ Minimum M value disply] ((theta, Minimum M value) graph) are displayed. Where r value:Lankfordn value M value:Taylor factor theta:Angle from TD direction to RD direction |
| Analysis Example [M value display] : (r value,M value) graph for each theta  |
| Analysis Example [r value display] : (theta,r value) graph  |
| |
Home |
Back |
|